
Questa Visualizer Debug
Overview
High performance, scalable, context-aware debug supporting the complete logic verification flow including simulation, emulation, prototyping, testbench, low-power, and assertion analysis. Intuitive and easy to use, Questa Visualizer improves debug productivity of today’s complex SoCs and FPGAs.
Visualizer has several features that improve debug productivity for SystemVerilog/UVM, transaction-level, RTL, gate-level and low-power design and verification. It provides a full set of synchronised views for analysing waveforms, source code, and connectivity.
Introducing Questa Visualizer
Debug is one of the most important verification technologies and is critical for achieving productivity in today’s complex designs. Companies need debug tools that provide maximum performance, capacity and automation for the complete system-on-chip design and verification cycle.
More complex designs that include more software create new requirements for block-to-system verification reuse and the need for system verification and debug. To avoid wasting cycles at the system level, it is critical to identify bugs as early as possible and improve debug productivity.
Visualizer is a high-performance, high-capacity context-aware debugger that supports a complete logic verification flow, including simulation, emulation, and prototyping as well as design, testbench, low-power, and assertion analysis.
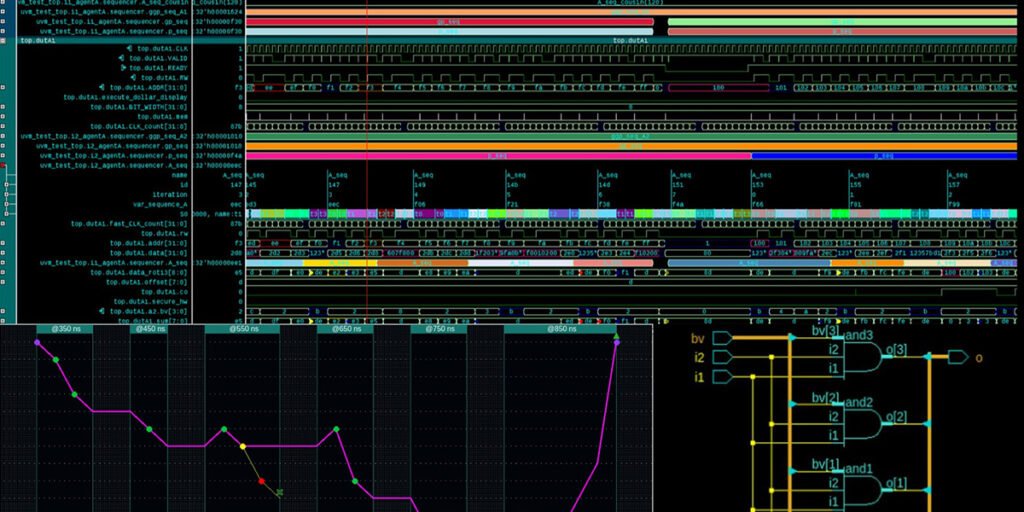
RTL Debug
Class object handles from the driver in a UVM testbench. These are all the transactions that were sent from the sequencer to the driver. The Virtual interface is also shown, along with the transactions from the channel. Additionally the values displayed are colored according to the biometric searches that have been created.
Root Cause Analysis
The Questa Visualizer Debug Environment allows you to find unknowns (X values), trace an event back in time to the root cause of that event through multiple clock domains and find origins of unknowns using the Time Cone window.
Causality Tracing
Automatic fan-in display using signal highlight from a signal back to the next primary input or flip flop.
Physical Connectivity
The Logic Cone window allows you to explore the “physical” connectivity of your design, to trace signals that propagate through the design, and to identify the cause of unexpected inputs, by showing a graphic view of the RTL objects in your design.
Interested in Questa Visualizer Debug?
Contact us to Learn More
The Verification Academy
The Verification Academy is a collection of free online courses, focusing on various key aspects of advanced functional verification.
Software for IC Verification

QuestaSim
Simulation and Debug
Combines high performance and capacity simulation with unified advanced debug and functional coverage for the most complete native support of Verilog, SystemVerilog, VHDL, …
Catapult HLS
HLS and Verification
Industry leading C++ / SystemC High-Level Synthesis with Low-Power estimation / optimization. Design checking, code, and functional coverage verification plus formal make HLS more than ….

Questa Inspect
Static RTL Bug Hunting
A fully-automatic formal bug hunting app that finds deeply hidden bugs due to common RTL coding errors, Inspect makes it possible to eliminate a wide range of bugs without a testbench.

Questa CDC
CDC Verification
Questa CDC finds errors using structural analysis to detect clock-domains, synchronisers, and low power structures via the UPF. It then generates assertions and metastability models for …

Questa Lint
Static RTL Verification
Questa Lint provides adaptive, integrated insight to the designer to ensure that the quality requirements and intent are met. Pre-configured methodologies provide immediate, intuitive feedback …
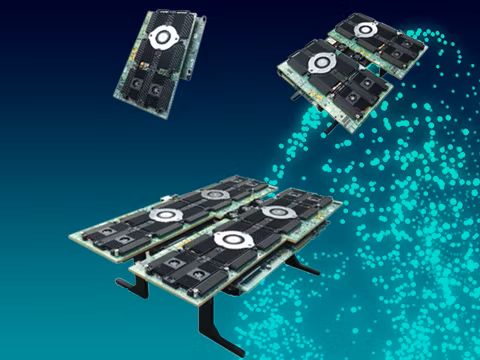
Veloce proFPGA
Hardware-Assisted Verification
The Veloce proFPGA system architecture offers best-in-class modularity, scalability, flexibility and portability to serve the verification requirements of today’s hardware and software engineers.